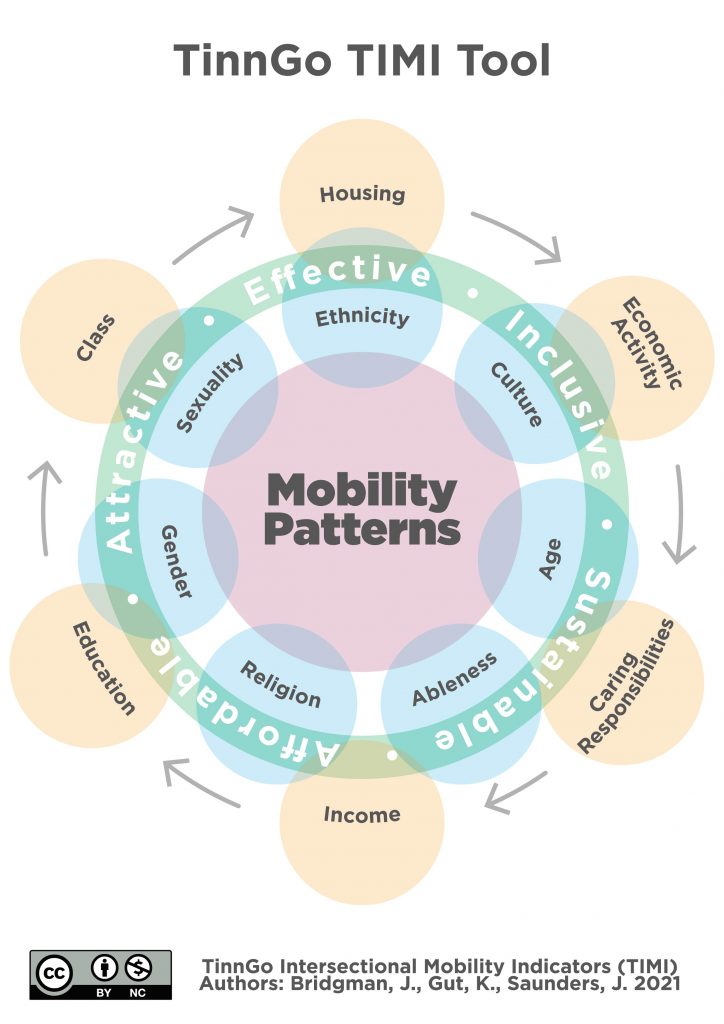
TinnGo Intersectional Mobility Indicators (TIMI)

TIMI is a set of intersectional mobility indicators we have developed to enable transport policy makers and practitioners visualise the overlapping (intersectional) nature of individual characteristics and structural aspects of transport poverty, and how they relate to smart mobility and mobility patterns. The origins of the tool came from the principle that transport is the glue that holds many facets of everyday life together. Where you live, work, go to school, shop or socialise is influenced by transport. Unequal access to transport is a major contributory factor in social exclusion.  We have symbolised this as the strands of a fibre optic cable all wound together.

Significant similarities can be observed when comparing Intersectional policy analysis frameworks to transport inequality reports. Both relate to power, social justice and equity together with intersecting characteristics such as (but not limited to) gender, race and class.

The 5 indicators of smart mobility as developed in the Tinngo project are used to evaluate how `smart` is the mobility system in the context of social innovation and how responsive it is to real needs and mobility patterns of different groups.

The TIMI model draws attention to the overlapping nature of inclusive transport elements. Identity characteristics, social and structural dimensions and the indicators of smart mobility.

The Orange outer ring symbolises structural and political factors of transport poverty and social exclusion such as housing and economic activity and the blue ring the intersectional characteristics on a more individual level. The green ring Shown here shows the 5 indicators of smart mobility used in TinnGO to evaluate how `smart` is the mobility system in the context of social innovation and how responsive it is to real needs and mobility patterns of different groups.

This is not a fixed tool and the characteristics mentioned are by no means limited to those presented in the diagram. It can be printed off and rotated in a similar way to a colour wheel. This tool is designed to prompt discussion but equally could also be used to measure impact, and it highlights how all systems need to be read together to foster equity based policy solutions.