From November 2020 until February 2021, TInnGO WP7 “Data analysis and modelling”, led by the Portuguese company VTM, ran a survey to explore mobility patterns in different European cities:
- Turin Metropolitan Area (Italy)
- Thessaloniki Metropolitan Area (Greece)
- Valencia Metropolitan Area (Spain)
- Paris Metropolitan Area (France)
- Mälmo Metropolitan Area (Scandinavia)
- Vilnius District (Baltic countries)
- Western Thuringia Region (Germany)
- Lisbon Metropolitan Area (Portugal)
- Alba Iulia Metropolitan Area (Romania)
- Birmingham Metropolitan Area (United Kingdom)
This study aims to explore the effects that the intrinsic/ socio-economic/ background characteristics of individuals have on the way they move and how it affects their ability to integrate into society and access employment opportunities. Therefore, the role of the transport system in different environments is being explored. The way in which the transport system affects individuals with different attributes, and the impact of these on perceptions and evaluations of the transport system will be analysed.
The objective of this survey is to understand, for the ten hub countries involved in this project:
- the main drivers of mobility for different groups in terms of age, gender and diversity (AGD);
- commuters’ choices, particularly women in different metropolitan areas with distinct transport systems;
- the impact of personal characteristics and daily activities in the choice of transport modes, including, for example, constraints in terms of physical access to services;
- how each transport system affects women’s mobility behaviour;
- the perception of different AGD groups regarding new transport policies, technologies, and services.
Following an intersectional approach, the outcome will be sustainable Gender Smart Mobility Plans seeking to engage different AGD groups in the ten metropolitan areas analysed for policymakers and transport planners.
Below you will find some visual results collected. For more detailed information on the results of each European city/region, download the Report 7.2 Modelling and forecasting of gender mobility behaviour for pilot cities.
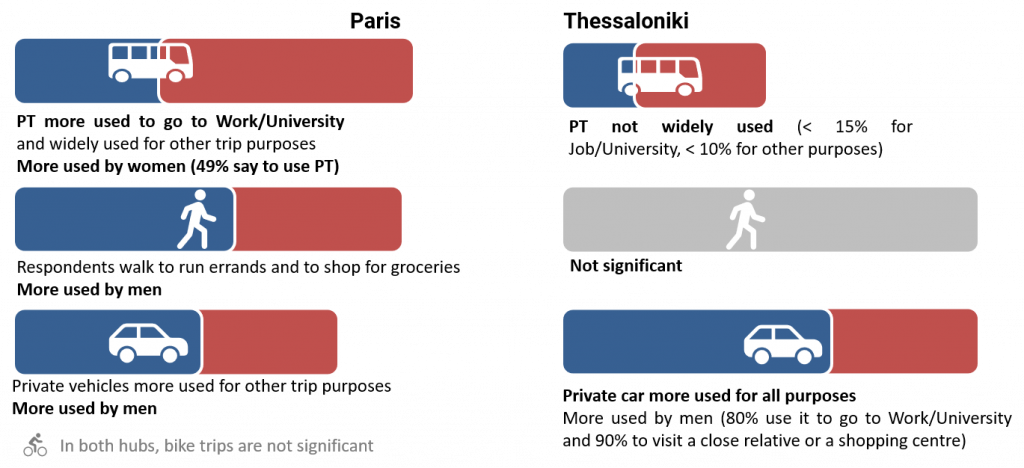
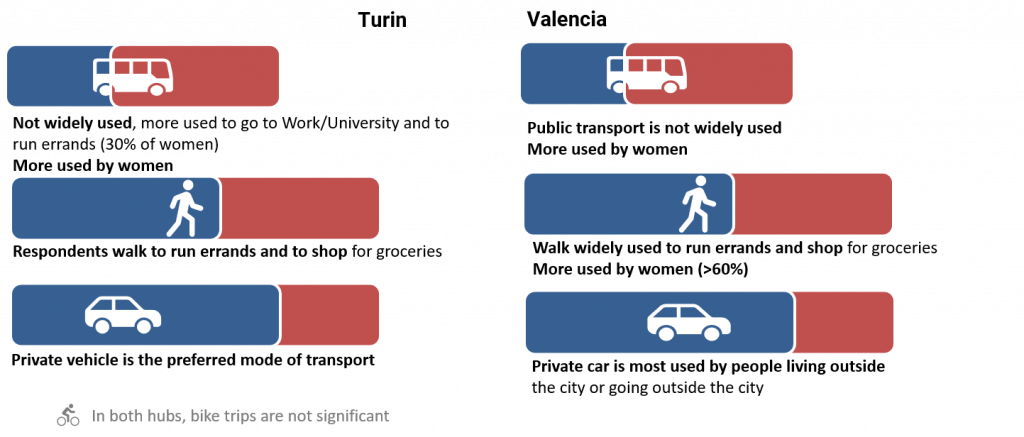
Modes of transport used in the metropolitan areas
The following graphs show the distribution of the most used modes of transport (PT-public transport, private vehicle, and soft modes) during the most frequent journey during the current situation of the pandemic in the metropolitan areas of Paris, Turin, Thessaloniki, and Valencia.
Mode choice by trip purpose in the metropolitan areas
The aim of these graphs is to provide a better understanding of the mode of transport used by the respondents for each type of trip. Therefore, in these graphics you can see the percentage of people who use each transport mode for each trip purpose in the metropolitan areas case studies.
Mobility patterns by gender vs trip purpose
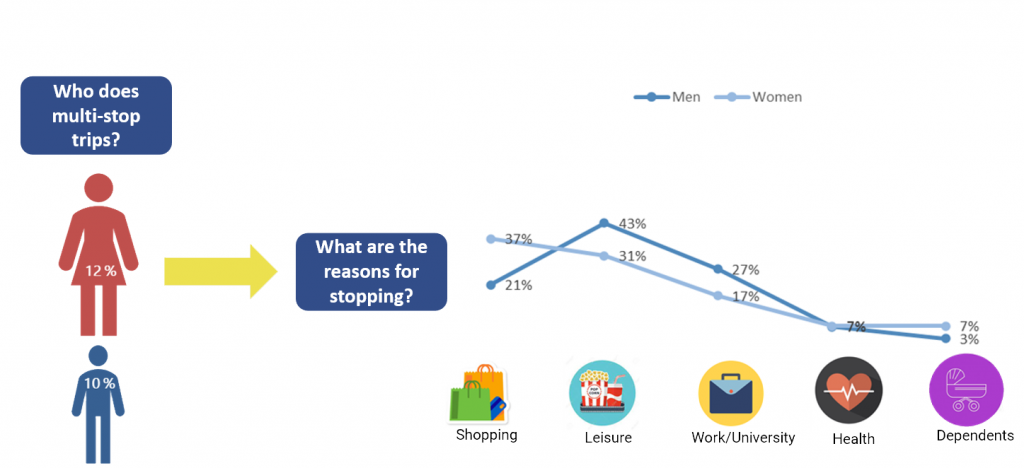
This graphic aims to analyze travel patterns according to gender. This means that through different survey questions the study achieved to identify by gender and by trip purpose, whether the respondents usually make stops during their most frequent journeys, and the reasons for those stops. This is to provide a better understanding of how sociodemographic characteristics affect mobility patterns of different users and to what extent cultures and societies have an impact on the comparison of all participating hubs.
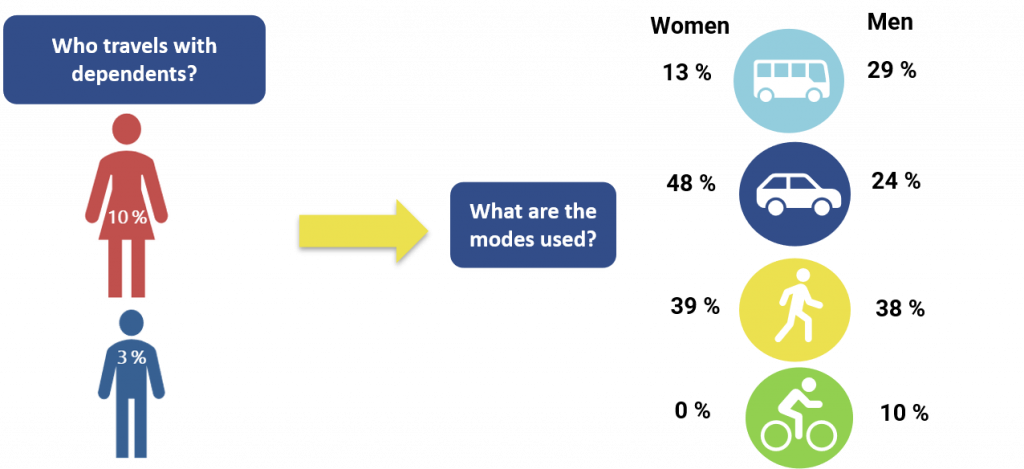
Mobility patterns by gender vs trip purpose: Valencia case study
This graphic represents the results for the Valencia data analyses including the variable “dependents”. The graphic shows the most used mode of transport by gender filtered by this variable. In this case we have decided to show the Valencia case study because regarding the choice of mode of transport for people who travel with dependents, it was possible to see that both genders choose private vehicles. However, the case of Valencia is the exception. As you can see in the figure, women choose more the car while more men have stated that they move with their dependents on foot.
Distance traveled in the metropolitan areas
Trends:
- Working age men travel longer distances (25 to 64);
- Younger women travel longer distances (18 to 25);
- For women over 75 years-old there is no clear trend.
- In Turin and Valencia, women make the longest journeys.
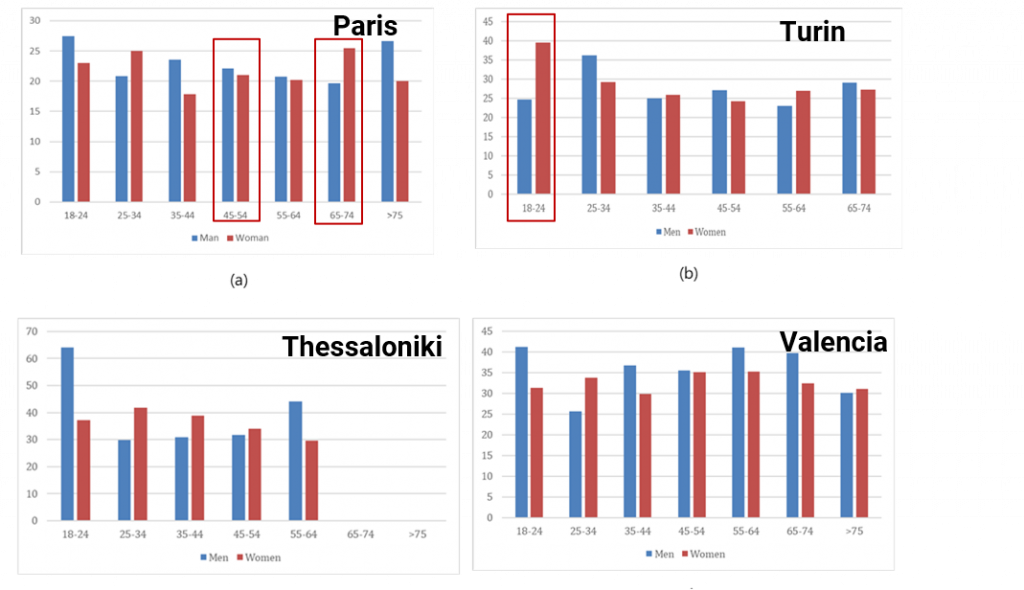
Trip duration in the metropolitan areas
Trends:
- Paris:
- Women (25-34 and 65-74) take longer on the most frequent journey
- Turin:
- In younger age groups, women stated that it took them in average 40 min to go to work/school, while the same journey took men 25 min
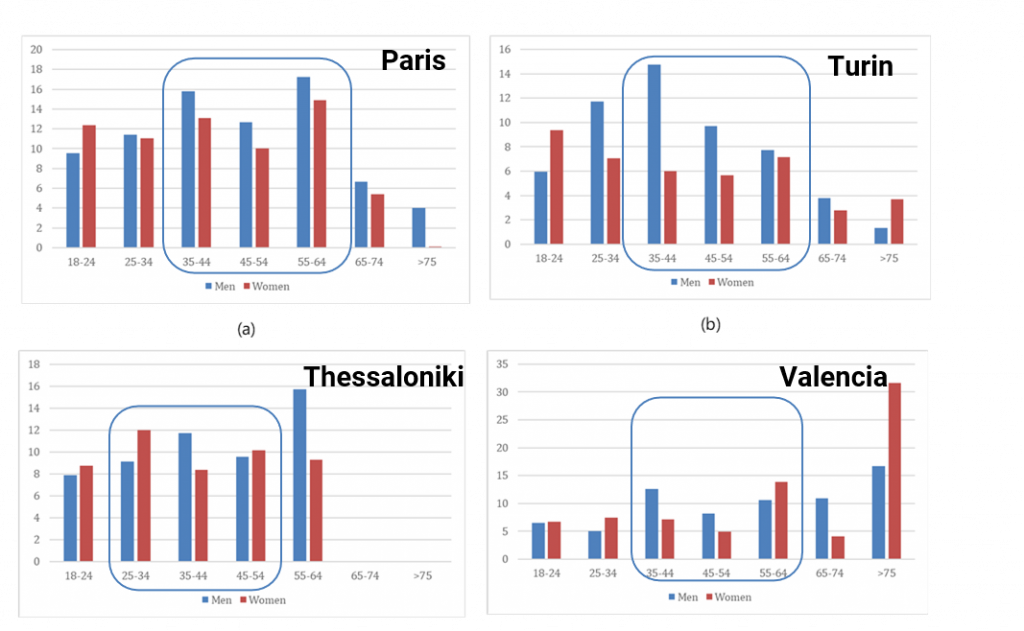
Harassment experiences as travellers in six metropolitan areas (Paris, Turin, Thessaloniki, Valencia, Lisbon and Mälmo)

- 372 out of 1955 respondents stated having had a harassment experience as travellers – the percentage of harassment incidents ranging from 6% (Valencia) to 39% (Mälmo) which shows that some metropolitan areas that have taken measures to increase security had lower harassment rates
- A relatively low percentage of travellers reported the incident, from 17% (Malmo) to 35% (Paris), giving an average of only 21% of these incidents reported
- Men have higher rated security aspects in public transport compared to women. Women feel less satisfied with crowding and less safe when many people are gathered at waiting areas or onboard.
- Concerning accessibility of public transport areas, women also have much lower satisfaction rates
- Older people and people with dependents call for better infrastructure, young men seek integration in mobility services, and young women request improvements in security aspects
- Residents in urban areas tend to be more satisfied with public transport features, while those living in rural areas tend to be overall dissatisfied
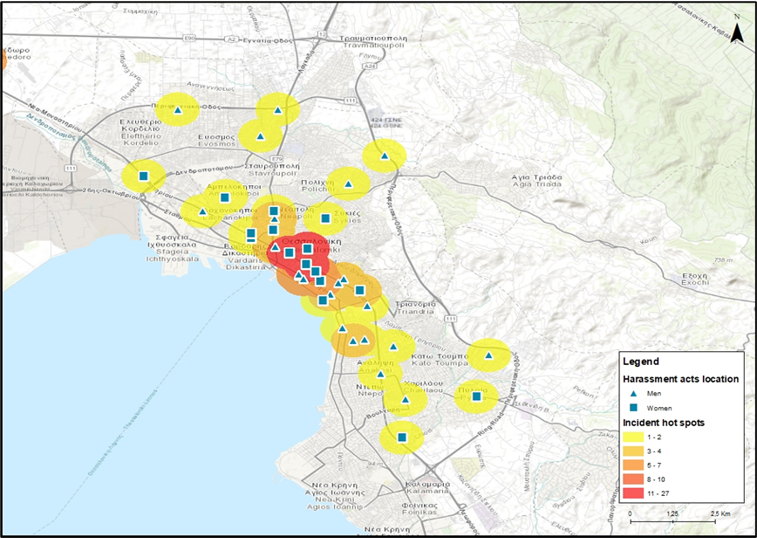
Harassment in the metropolitan areas - Greek hub case: Thessaloniki

Harassment in the metropolitan areas - French hub case: Paris

Future trends in public transport
- Transport services that adjust the routes according to passenger needs (Turin)
- Provision of suitable connections between sidewalk and bus/train/metro to facilitate the boarding process (Paris)
- Provision of panic/alarm buttons at bus stops/ stations (Paris, Valencia)
- Provision of panic/alarm buttons inside vehicles (Paris, Valencia)
- Provision of a reliable camera surveillance system at bus stops/ stations
Mobility patterns from a gender perspective for all 10 regions
Travellers’ behaviour show a preference for traditional transport modes such as cars and public transport
The use of bicycles is not yet prevalent, and the shared modes are not widespread
Women travel shorter distances and take longer to arrive at their destination and they use more public transport than men
The car is the most popular transport choice regarding respondents’ most frequent journeys, with men as drivers and women as passengers
The number of stops along the main journey is higher for women. Most women make intermediate stops for shopping and men for leisure and work/study reasons
Regarding the choice of mode of transport for people who travel with the dependents, it was possible to see that in most of the datasets, both genders choose private vehicles. Biking and PT are less preferred modes when travelling with dependents, which may be evidence of low accessibility to public transport for the vulnerable population
